Quick Guide to Particle Size Distribution

What is particle size distribution?
Particle size distribution (PSD) is the means of measuring the number of particles by mass and size to calculate a size and mass range. This process can be applied to powders, granules, and particles dispersed in fluids. In theory, a particle size distribution is obtained by taking the minimum diameter and standard deviation of a perfect sphere, assuming a normal distribution.
In pharmaceuticals, the process of determining PSD is generally more complex as particles are rarely perfect spheres, do not conform to a normal distribution due to blends of different sized materials, and can contain large numbers of small particles (fines). For these reasons, it is necessary to have a particle size quantification system better suited to the specific requirements of the pharmaceutical industry, and D-values fit this requirement well.
What Is the Purpose of Particle Size Distribution Analysis?
Particle size distribution analysis is used to determine the average size of a group of particles. This information can be used to help determine how well a product will perform in a given application. For example, it can be used to identify potential sources of contamination or whether there are any particles that are too small to be detected (e.g., aerosols in products.
Particle size distribution analysis can provide great value for manufacturers because it allows them to identify possible sources of contamination while ensuring they are producing high quality products. It can also uncover opportunities for improving production processes and quality control.
Importance of particle size distribution?
The importance of particle size analysis in pharma manufacturing is significant. Knowing the PSD is highly important as it allows for far greater process control. With increased control, dissolution rates, drug uniformity, drug bioavailability, and quality targets can be achieved more easily.
What is d10 d50 d90 in particle size distribution?
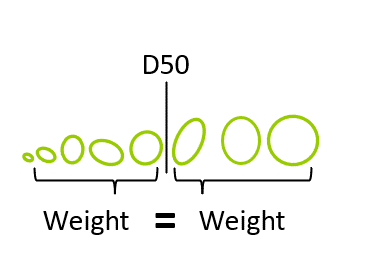
D-values can be thought of as a mass division diameter. It is the diameter which, when all particles in a sample are arranged in order of ascending mass, divides the sample’s mass into specified percentages. The percentage mass below the diameter of interest is the number expressed after the “D”. The D10 diameter is the diameter at which 10% of a sample’s mass is comprised of smaller particles, the D50 is the diameter at which 50% of a sample’s mass is comprised of smaller particles, and the D90 is the diameter at which 90% of a sample’s mass is made up of smaller particles.
Difference between particle size and particle size distribution
Particle size is the term used to describe the measuring of the size of solid matter as they are found in nature. It can also refer to a measurement of the size of liquid matter as it is aided by a microscope. Whereas particle size distribution refers to the measurements of particle size for a given sample. Particle size distribution can be used to determine whether or not the particles are homogenous (size, shape, and distribution are equal). Particle size can also be used to determine if there is an excess of one particle type over another.
How to determine particle size?
D-values are relatively simple to compute but are challenging to determine for a real product in real-time. The main obstacle is quantifying the size of the particles.
The most common methods to determine particle size include;
- Direct image analysis
- Sieve Analysis
- Laser Diffraction
- Dynamic Light Scattering
What’s the best method for particle size distribution?
A novel method to determine particle size is direct imaging, like our Eyecon2 Particle Size Analyzer. In direct imaging, particles are illuminated and imaged from the same side. This allows the method to be easily used both in bench-top and in-line applications.
A major advantage of this method is it non-invasive with no product contact and it is non-destructive. Direct imaging affords greater flexibility with adjustable max and min diameters to shape measurement detection and it negates false detection of shadowing particles, where small fine particles hide in front of larger particles. Check out our whitepaper on methods of particle size determination to find out more about the most popular methods.
How to calculate particle size?
While D-values are based on a division of the mass of a sample by diameter, the actual mass of the particles or the sample does not need to be known. A relative mass is sufficient as D-values are concerned only with a ratio of masses. This allows the optical measurement systems to be used without any need for sample weighing. From the diameter values obtained for each particle a relative mass can be assigned.
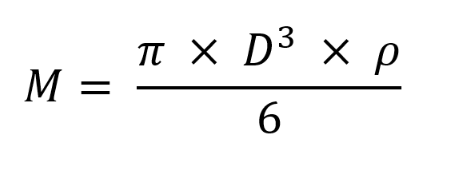
Assuming that ρ is constant for all particles and cancelling all constants from the equation:
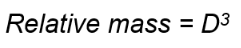
Each particle’s diameter is therefore cubed to give its relative mass. These values can be summed to calculate the total relative mass of the sample measured. The values may then be arranged in ascending order and added iteratively until the total reaches 10%, 50% or 90% of the total relative mass of the sample. The corresponding D-value for each of these is the diameter of the last particle added.
What are the four classifications of particle size distribution?
There are four main classifications of particle size distribution;
- Large-particle (LPO): particles that are at least 2 micrometers in size;
- Small-particle (SPO): particles that are less than 2 micrometers in size, but not necessarily less than 0.5 micrometer;
- Medium-particle (MPO): particles that are between 0.5 and 2 micrometer in size;
- Ultra-fine-particle (UFP): particles that are less than 0.05 micrometer in size.
Technology for Particle Size Distribution
The Eyecon2 is a direct imaging particle size analyzer. It can be used both on powders and bulk solids to rapidly determine particle size, shape, and variation.
The Eyecon2 uses imaging to measure bulk wet and dry powders and calculates PSDs on the level of individual particles. The captured images are passed through an algorithm which can identify and measure particle size distributions.
With Eyecon2, analysis is efficient and automatic, which reduces time and production cost and also minimizes workers’ exposure to hazardous materials.
To learn more about InnoGlobal Technology’s (formerly Innopharma Technology) Eyecon2 can help you carry out particle size distribution analysis efficiently and effectively, download the free product brochure or talk to a member of our team today!